
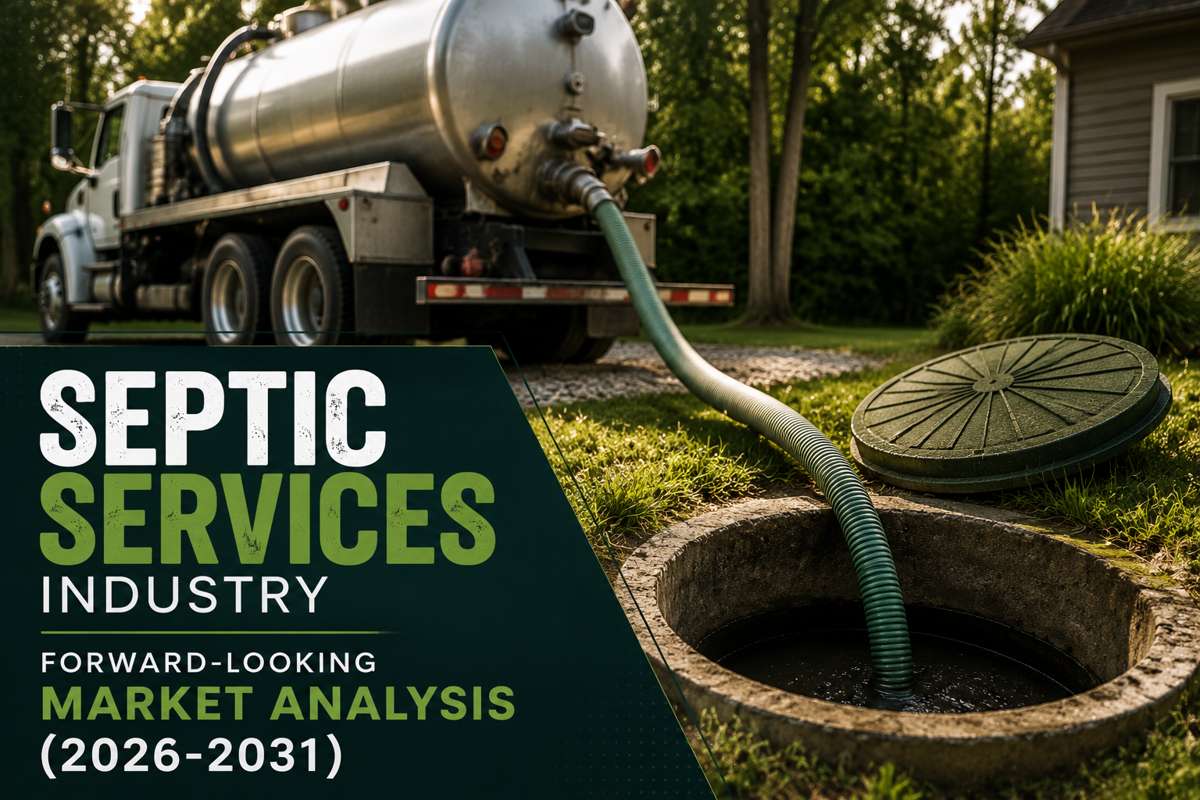
A forward-looking analysis of onsite wastewater and septic services across the United States, with global context, covering market size, competitive structure, technology, regulation, and strategy for 2026 through 2031.
1. Executive Summary
1.1 Synthesis Overview
The septic services sector, the collection, pumping, inspection, repair, and installation of onsite wastewater treatment systems, is a large, stable, and quietly essential corner of the environmental services economy. Demand is structurally non-discretionary: roughly one in five US households depends on a septic or other onsite system, and those systems must be pumped, inspected, and eventually repaired or replaced regardless of the economic cycle. That resilience, combined with an aging installed base and tightening water-quality regulation, underpins a favorable multi-year outlook.
On the services side, IBISWorld sizes the US septic, drain and sewer cleaning industry at about $8.1 billion in 2025, up 4.3% year over year, after a 6.7% compound annual growth rate from 2020 to 2025 (IBISWorld). A broader Census-based category pairing septic tank cleaning with portable-toilet rental (NAICS 56299) is larger, at roughly $11.4 billion for 2026 by IBISWorld’s estimate. Globally, the wider septic solutions market that bundles equipment with services is valued between about $6.7 billion and $7.8 billion in 2025 and 2026 by Coherent Market Insights, Future Market Report, and others, with projections reaching $11 billion to $14.5 billion by the early 2030s at compound growth near 7.5% to 7.9%.
Extending the sourced US services trajectory across the 2026 to 2031 window, a reasonable base case places the US septic services market near $10.5 billion to $11 billion by 2031, a mid-single-digit compound growth rate. That headline masks a two-speed market: routine pumping and maintenance grow steadily with the installed base, while advanced-treatment installation and system rehabilitation grow faster, pushed by nitrogen limits, failing legacy systems, and Sunbelt exurban construction.
Directional verdict: steady, non-cyclical growth (moderate). The sector is not a breakout high-growth story, but it is a durable, recession-resistant one with widening pockets of faster growth. The defining dynamic through 2031 is consolidation: private-equity-backed platforms are rolling up a highly fragmented base of local operators, professionalizing operations and raising the competitive bar. For an independent operator, the strategic question is no longer whether to modernize, but whether to compete on local density and recurring contracts, or eventually to partner with or sell into a consolidator on favorable terms.
2. Present-Day Sector Overview
2a. Sector Definition and Scope
Septic services cover the full lifecycle of onsite wastewater treatment systems, which the EPA also calls decentralized or onsite systems. The core service lines are: routine septic pumping and tank cleaning; jetting and drain-line clearing; inspections and assessments (including point-of-sale inspections tied to real estate transactions, plus capacity and soil evaluation); repairs and component replacement; new system design and installation; grease-trap and commercial liquid-waste service; and emergency response to backups and failures. Adjacent to residential work sits a commercial and municipal stream of grease, food waste, and non-hazardous liquid-waste hauling.
This report centers on the services market in the United States, since that is where the featured operator competes, and treats septic equipment manufacturing (tanks, chambers, advanced treatment units) and the global market as context. The scope deliberately excludes centralized municipal sewage treatment, which is a substitute rather than part of the sector.
2b. Market Size and Current Valuation
Estimates vary by how the category is drawn, so the figures below are presented as a range with each source named:
- US septic, drain and sewer cleaning services: about $8.1 billion in 2025, growing 4.3% that year, per IBISWorld, which also reports a 6.7% compound annual growth rate across 2020 to 2025 and roughly 7,300 active businesses.
- US portable toilet rental and septic tank cleaning (NAICS 56299): roughly $11.4 billion in 2026, expanding at about 3.4% compound growth over the prior five years, per IBISWorld. This wider category folds in event and construction sanitation.
- US septic tanks and portable toilets: about $6.7 billion in 2025 across roughly 3,600 companies, with the top four holding just a 11.4% share and average sales per location near $1.8 million, per Kentley Insights. American Liquid Waste separately pegs US septic cleaning and maintenance near $7 billion for 2025.
- Global septic solutions (equipment plus services): valued at about $6.7 billion to $7.8 billion in 2025 and 2026 and projected to reach $11.3 billion to $14.5 billion by 2032 and 2033 at roughly 7.5% to 7.9% compound growth, per Coherent Market Insights, Future Market Report, and GII Research. Narrower global septic-tank equipment estimates run lower, from Market Research Future (about 3.4% growth) to Allied Market Research (5.2%, reaching roughly $8 billion by 2031).
Taken together, the sourced figures describe a US services market of roughly $8 billion to $11 billion depending on category boundaries, sitting inside a global septic solutions market approaching the mid-teens of billions by the early 2030s. The consistent signal across firms is durable mid-single-digit to high-single-digit growth.
[IMAGE SUGGESTION: Column chart of US septic services market size, 2020 to 2031, showing IBISWorld actuals through 2025 (about $8.1B) and the base-case projection to about $10.9B. Source: Section 2b figures and Section 4a table.]
2c. Demand Drivers
- A large, aging installed base. The EPA estimates about 20% of US households rely on onsite systems, more than half of existing systems are over 30 years old, and 10% to 20% fail at some point in their operational life. Aging systems convert into pumping, repair, and replacement revenue.
- Non-discretionary, emergency-weighted demand. A backup or failure is an urgent, health-driven purchase that cannot be deferred, which insulates the sector from downturns and supports premium emergency pricing.
- Real estate transactions. Point-of-sale inspections are mandated or effectively required across many counties, tying a reliable inspection revenue stream to housing turnover.
- New exurban and rural construction. About one-third of new development is served by septic or other decentralized systems, per the EPA, concentrating new-installation demand in fast-growing Sunbelt and rural markets where sewer extension is uneconomical.
- Regulatory tightening. Nitrogen limits in sensitive watersheds are pushing conventional systems toward higher-value advanced treatment, expanding the installation and upgrade market.
2d. Sector Structure and Business Models
The sector is highly fragmented and route-based. With roughly 3,600 to 7,300 US businesses depending on category definition, and the top four players holding only about 11% share, this is a classic local-density market. The dominant model is the owner-operated regional firm running a fleet of vacuum trucks across a defined service radius. Revenue mixes one-time transactional work (pumping, inspections, emergency calls) with increasingly popular recurring service contracts that convert episodic customers into predictable annuities. Vertically integrated players extend downstream into septage processing and disposal, which both controls cost and creates a regulatory moat. Manufacturing (tanks, chambers, treatment units) is more concentrated and sits upstream of the service base.
2e. Headwinds
| Headwind | Description | Severity |
| Skilled-labor shortage | Aging technician workforce and thin trade pipelines constrain capacity; JLL projects up to 2.1 million unfilled US trades roles by 2030, and industry sources cite a need for hundreds of thousands more plumbers by 2027. | High |
| Septage disposal and PFAS | Tightening state rules on land application of biosolids and septage, amid the EPA’s evolving PFAS risk review, raise and destabilize disposal costs for haulers. | Medium |
| Input and fuel inflation | Vacuum trucks, parts, and diesel are cost-heavy; rising equipment lead times and fuel pass through to margins. | Medium |
| Housing-market sensitivity | Point-of-sale inspections and new installations soften when home sales and construction slow, even as maintenance holds. | Medium |
| Sewer extension | In select fringe areas, municipal sewer buildout permanently removes septic demand, though this is slow and localized. | Low |
| Consolidation pressure | PE-backed platforms outspend local firms on marketing, software, and recruiting, squeezing undifferentiated operators. | Medium |
3. Competitive Landscape
3a. Market Leaders
No single company dominates septic services nationally; leadership is split between the public drain-and-sewer major, the private-equity liquid-waste consolidator, the equipment giant, and fast-scaling home-services roll-up platforms. The table profiles representative leaders and their recent moves.
| Company / HQ | Market Position | Core Offering | Competitive Moat | Recent Moves | Growth Trajectory |
| Roto-Rooter (Chemed, NYSE: CHE), Cincinnati, OH | National leader in drain, sewer, and plumbing, with septic adjacency | Drain cleaning, sewer, plumbing, water cleanup; franchise plus company branches | Brand recognition, national footprint, franchise density | Roto-Rooter segment contributed about $911M of FY2025 revenue at a Q4 segment EBITDA margin near 21.5% | Steady, margin-led |
| Wind River Environmental (Gryphon Investors), Marlborough, MA | Largest US non-hazardous liquid-waste and septic consolidator | Septic pumping, grease traps, liquid-waste hauling, treatment and disposal | Vertical integration into disposal, super-regional route density, 100-plus acquisitions | Acquired Greenway and TCW (Charlotte, 2024), Brockwell’s Septic (VA, 2024), John Matthes Septic (NJ, 2023) | Strong via M&A |
| Advanced Drainage Systems / Infiltrator (NYSE: WMS), Hilliard, OH | Dominant onsite septic equipment maker | Plastic tanks, leachfield chambers, advanced treatment units, smart panels | Manufacturing scale, distribution network, conversion from concrete and stone | Bought Orenco Systems (2024); launched ECOPOD-NX advanced treatment (80% nitrogen reduction) | Strong, regulation-led |
| P3 Services (Stellex Capital), National | Growth-stage plumbing, septic and rooter platform | Residential and light-commercial plumbing, septic, drain and pipe lining | Buy-and-build platform, multi-region density, back-office scale | Acquired Forsyth Septic and Rooter (NC) among six 2024 add-ons across NC, TX, FL and WA | Rapid via roll-up |
| Apex Service Partners (Apollo / Alpine), National | Largest home-services roll-up by brand count | HVAC, plumbing and drain services across 100-plus local brands | Capital access, marketing scale, brand-retention model | Reported around 107 brands across 25-plus states after a 2025 Apollo investment valuing it near $10B | Rapid via roll-up |
| Norweco, Norwalk, OH | Independent advanced-treatment manufacturer | Aerated and nitrogen-reducing onsite treatment systems and media | Proprietary treatment technology, installer and distributor network | Continued expansion of nitrogen-reduction product lines as coastal and watershed rules tighten | Steady, regulation-led |
[IMAGE SUGGESTION: Competitive-positioning map plotting leaders by service breadth (equipment to full-service) against geographic reach (regional to national). Source: Section 3a profiles.]
3b. Emerging and Regional Challengers
Below the national names, the most consequential competitors are strong independent regional operators and the platforms racing to acquire them:
- Regional consolidators and PE add-on targets. Well-run local leaders with dense routes and recurring contracts are the prime acquisition currency for Wind River, P3, Apex, and similar buyers. Being an attractive target is itself a competitive position.
- Technology-forward operators. Independents adopting field-service software, online scheduling, and route optimization are pulling ahead on productivity; industry data shows high-performing home-services firms adopt AI-enabled tools at roughly triple the rate of laggards.
- Advanced-treatment installers. Contractors specializing in nitrogen-reducing and alternative systems capture the fastest-growing, highest-margin installation work in regulated watersheds.
- Real estate inspection specialists. Operators who build Realtor and title-company referral channels lock in a steady, relationship-driven inspection stream that national chains struggle to replicate locally.
3b.1 Company Spotlight: Black Water Septic Pros
What they do. Black Water Septic Pros is a full-service, locally owned septic company serving Southwest Ohio, including Hamilton, Fairfield, West Chester, and Middletown, with close to 30 years in the market. The company spans the complete service lifecycle: routine pumping and customized service contracts, preventative jetting, mandated inspections for home sales, comprehensive assessments (capacity and soil testing), repairs, complete new-system installation, and seven-days-a-week emergency response. That breadth lets it serve all three of its core customer types, proactive homeowners, real estate transactors, and emergency or distressed property owners, from a single brand.
Where it plays and its moat. The company deliberately targets the market’s middle ground, positioning between low-cost, one-person operators and impersonal national chains. Its differentiation rests on licensed and certified technicians (including NOWRA and NAWT credentials), modern vacuum trucks and diagnostic tools, and deep local knowledge of Ohio soils and environmental standards. The recurring service-contract model and the Realtor-facing inspection channel are its two most defensible assets, because both convert one-time work into durable relationships and referral flow that national marketing budgets struggle to displace at the neighborhood level.
Honest read on positioning. Black Water sits exactly where the sector’s value is concentrating: prevention, recurring contracts, and the transaction-driven inspection channel, and its nearly three-decade local reputation is a genuine moat in a trust-sensitive category. The candid challenge is scale in a consolidating market. The same private-equity roll-up wave now buying regional septic leaders across the country is both a competitive threat, since platform buyers bring deeper marketing and recruiting budgets, and a strategic opportunity, since a well-run independent with dense routes and contract annuities is precisely the profile those buyers pay premium multiples to acquire. The priorities that follow from the sector analysis are to deepen recurring-contract penetration, continue professionalizing digital operations, and defend the local brand against national-chain spend, whether the long-term goal is durable independence or an eventual partnership on favorable terms. Its position is credible and well-aligned to where the market is heading; the work is to convert local trust into locked-in recurring revenue before better-capitalized entrants compete for it.
3c. Competitive Rivalry: Porter’s Five Forces
| Force | Rating | Rationale |
| Threat of new entrants | Medium | A single truck and a license clears a low bar to entry, but building route density, disposal access, and a trusted local brand is hard; PE-funded entrants raise the stakes. |
| Bargaining power of buyers | Low to Medium | Residential demand is fragmented, non-discretionary, and often urgent, limiting buyer leverage, though online price transparency is rising for routine pumping. |
| Bargaining power of suppliers | Medium | Equipment (tanks, trucks) is supplied by consolidated makers such as ADS/Infiltrator, and disposal-site access is gated; the tightest supplier constraint is skilled labor. |
| Threat of substitutes | Low | Connection to a municipal sewer is the only true substitute and is unavailable or uneconomical across most septic-served exurban and rural areas. |
| Competitive rivalry | Medium to High | A fragmented base of thousands of operators competes on local density and responsiveness, with consolidators intensifying rivalry in target metros. |
4. Forward-Looking Analysis and Forecast (2026–2031)
4a. Market-Size Projection: Bull, Base and Bear
The scenarios below extend the US septic services market from an IBISWorld 2025 base of about $8.1 billion to 2031. The historical anchors are IBISWorld’s 6.7% compound growth (2020 to 2025), its 4.3% print for 2025, and the roughly 3.4% to 8.3% five-year growth range reported across the broader category by IBISWorld and Kentley Insights. The 2031 values are reasoned projections built on those sourced growth rates, not published point forecasts.
| Scenario | 2031 US market size | Implied CAGR | Key assumption |
| Bull | About $12.2 billion | ~7% | Strong exurban construction, aggressive advanced-treatment mandates, and rapid contract adoption lift growth toward the high-single digits. |
| Base | About $10.9 billion | ~5% | Steady maintenance demand, moderate housing turnover, and gradual regulatory tightening sustain mid-single-digit growth. |
| Bear | About $9.7 billion | ~3% | A housing slowdown and disposal-cost pressure trim installations and inspections, though non-discretionary maintenance holds the floor. |
[IMAGE SUGGESTION: Grouped column chart comparing bull, base and bear US market size at 2031 against the 2025 base of about $8.1B. Source: Section 4a table.]
4b. Growth Catalysts
- Failing legacy systems. With most systems past 30 years old, replacement and rehabilitation demand compounds regardless of new construction.
- Advanced-treatment upgrades. Nitrogen and watershed rules convert conventional installs into higher-value advanced systems such as the ECOPOD-NX line, lifting revenue per job.
- Public funding. The Clean Water State Revolving Fund and America’s Water Infrastructure Act channel support for failing-system replacement, especially for lower-income rural households, underwriting demand that might otherwise be deferred.
- Recurring-contract adoption. As operators sell subscription-style maintenance plans, revenue becomes more predictable and customer lifetime value rises.
- Consolidation capital. PE inflows fund route densification, technology, and recruiting, expanding served demand even as they reshape competition.
4c. Technology and Innovation
| Technology vector | What it changes | Adoption outlook |
| Advanced / nitrogen-reducing treatment | Systems such as ECOPOD-NX cut total nitrogen by around 80%, meeting stricter watershed rules and raising install value | Accelerating in regulated regions |
| Remote monitoring and smart panels | IoT sensors and intelligent pump controls (for example, Aquaworx) flag issues early and enable service-contract upsell | Early but growing |
| Field-service software and AI dispatch | Platforms like ServiceTitan optimize scheduling, routing and online booking; high performers adopt at roughly triple the rate of laggards | Mainstreaming fast |
| Trenchless and CIPP repair | Cured-in-place and trenchless methods cut disruption and cost for line repair and rehabilitation | Steady adoption |
| Fleet telematics and route optimization | Lowers fuel and labor cost per stop, a direct margin lever amid rising input costs | Widening |
| Digital inspection reporting | Branded, shareable PDF inspection reports strengthen the Realtor and title-company channel. | Differentiator for independents |
4d. Sub-Segment Outlook
| Sub-segment | Growth outlook | Driver |
| New-system installation (advanced treatment) | Strongest | Nitrogen rules and exurban construction; highest revenue per job |
| Repair and rehabilitation | Strong | Aging, failing installed base |
| Routine pumping and service contracts | Steady | Recurring, non-discretionary maintenance |
| Real estate inspections | Moderate, housing-linked | Point-of-sale mandates and home turnover |
| Grease trap and commercial liquid waste | Steady | Restaurant and commercial compliance |
| Emergency response | Steady, premium-priced | Backups and failures, weather events |
[IMAGE SUGGESTION: Bar chart ranking septic services sub-segments by projected growth outlook through 2031. Source: Section 4d table.]
4e. Regulatory Outlook
Onsite systems are regulated primarily at the state, tribal, and local level; the EPA does not regulate single-family septic systems directly, and local health departments issue most permits. Three regulatory currents will shape 2026 to 2031. First, nitrogen and watershed protection rules in coastal and nitrogen-limited areas (for example, Chesapeake Bay, Cape Cod, Long Island, and parts of Florida) increasingly require advanced treatment, expanding upgrade demand. Second, PFAS and biosolids oversight is in flux: the EPA issued a draft sewage-sludge risk assessment for PFOA and PFOS in January 2025 and follow-up draft guidance in mid-2026, while states move independently to restrict land application of biosolids and septage, which raises and destabilizes disposal costs for haulers. Third, funding and inspection mandates, including Clean Water State Revolving Fund loans and county point-of-sale inspection requirements, act as demand tailwinds. The net effect is a regulatory environment that adds cost on the disposal side but expands revenue on the upgrade, inspection, and replacement side.
4f. Geographic Hotspots
Septic reliance is highly uneven. The EPA notes onsite-system density ranges from about 55% of homes in Vermont to roughly 10% in California, with high concentrations across New England, the Southeast, Appalachia, and the rural Midwest. Three geographies stand out for growth: Sunbelt exurban corridors (Texas, Florida, the Carolinas, Georgia), where new decentralized installations track rapid construction; coastal nitrogen-limited watersheds, where advanced-treatment upgrades are mandated; and the rural Midwest and Ohio Valley, where a dense, aging installed base sustains steady pumping, repair, and replacement demand. Ohio, home to major equipment maker Advanced Drainage Systems and a large stock of aging rural and exurban systems, is a representative steady-demand market rather than a boom market, favoring operators who win on service depth and local trust.
[IMAGE SUGGESTION: US map or regional bar chart shading states by septic-household density and highlighting Sunbelt, coastal-watershed and Midwest growth zones. Source: Section 4f and EPA density figures.]
4g. Risk Matrix
| Risk | Probability | Impact | Notes |
| Skilled-labor shortage caps capacity | High | High | Aging technicians and thin pipelines limit how much demand operators can serve; the binding constraint on growth. |
| Housing-market downturn | Medium | Medium | Cuts inspections and new installs; maintenance revenue cushions the floor. |
| PFAS-driven disposal restrictions | Medium | Medium to High | State and possible federal limits on septage and biosolids land application raise haulers’ disposal costs. |
| Input and fuel inflation | Medium | Medium | Compresses margins on route-based work; partly offset by telematics and pricing. |
| Black swan: national ban on land application of septage and biosolids | Low | High | An abrupt federal PFAS-driven prohibition would sharply raise disposal costs sector-wide, forcing rapid investment in alternative treatment and disposal capacity. |
5. Strategic Implications
5a. Where Value Accrues
Through 2031, economic value concentrates in five places: recurring service contracts that turn episodic customers into annuities; route density, which lowers cost per stop and is the core of every roll-up thesis; advanced-treatment installation, the highest-margin, fastest-growing sub-segment; the real estate inspection channel, a durable, referral-driven stream; and vertical integration into disposal, which controls the cost most exposed to PFAS-era regulation. Operators concentrated in transactional, one-off pumping with no contract base and no disposal control are the most exposed to both margin pressure and competitive displacement.
5b. Competitive Positioning
The market is splitting into three tiers: national and super-regional platforms competing on capital and marketing scale; strong independents competing on local density, responsiveness, and trust; and undifferentiated one-truck operators increasingly squeezed from both sides. The durable middle position, and the one most valued by acquirers, is the professionalized independent with dense routes, certified technicians, a recurring-contract book, and a defensible referral channel. That is a winnable position precisely because trust, response time, and local knowledge do not scale easily from a national headquarters.
5c. Marketing and Go-To-Market
The most effective go-to-market for a full-service regional operator maps directly to the sector’s three demand pools, which align with Black Water Septic Pros’ own customer profiles:
- Proactive homeowners (the recurring-revenue core). Lead with education and prevention, not scare tactics, and package maintenance into subscription-style service contracts with clear, branded reporting after each visit. Reach them through local SEO, a well-managed Google Business Profile, seasonal reminders, and neighborhood-targeted direct mail.
- Real estate transactors (buyers, sellers, agents). Build a Realtor and title-company referral engine around fast, compliant, professionally formatted digital inspection reports. Speed and documentation win this channel, and it is hard for national chains to replicate at the local relationship level.
- Emergency and distressed owners (premium, urgent). Compete on responsiveness and reassurance: prominent click-to-call, rapid dispatch, and calm, expert communication. This is the least price-sensitive segment and a powerful source of reviews and referrals when handled well.
Across all three, the differentiators to emphasize are certification and expertise (NOWRA and NAWT credentials, decades of local experience), modern equipment, and community roots, the exact attributes that separate a trusted local expert from both amateur operators and out-of-town chains. Investing early in digital operations, online booking, remote monitoring, and structured review generation compounds these advantages and raises the eventual value of the business.
6. Conclusion and Directional Outlook
Septic services enter the 2026 to 2031 window as a durable, non-cyclical growth sector rather than a high-flying one. A US services market near $8 billion to $11 billion in 2025 and 2026 is positioned to grow at a mid-single-digit base-case rate toward roughly $10.5 billion to $11 billion by 2031, with faster growth in advanced-treatment installation and system rehabilitation. Aging systems, non-discretionary demand, real estate inspection requirements, and tightening water-quality regulation are the tailwinds; a skilled-labor shortage and PFAS-era disposal costs are the principal drags. The overriding structural story is consolidation, as private-equity platforms professionalize a fragmented base and raise the competitive bar for everyone else.
For a full-service regional operator, the strategic path is clear, and it is the same path that makes an independent attractive to acquirers: build recurring revenue, densify routes, own the inspection channel, and modernize operations before better-capitalized competitors arrive.
6.1 Action Recommendations
- Convert episodic customers into recurring contracts. Prioritize subscription-style maintenance plans with branded post-service reporting to build a predictable annuity base and lift customer lifetime value.
- Own the real estate inspection channel. Formalize Realtor and title-company partnerships and deliver fast, compliant, professionally formatted digital inspection reports as a referral flywheel.
- Move up the value curve into advanced treatment. Build capability and certification in nitrogen-reducing and alternative systems to capture the highest-margin, fastest-growing installation work as watershed rules tighten.
- Modernize operations now. Adopt field-service software, online booking, route optimization, and remote monitoring to protect margins against labor and fuel inflation and to widen the productivity gap over slower rivals.
- Get ahead of disposal risk and consolidation. Secure reliable, compliant septage-disposal arrangements against PFAS-era uncertainty, and decide deliberately whether the long-term goal is durable independence or an eventual sale into a consolidator, then build the recurring-revenue and route-density profile that maximizes value under either path.
Author Profile

- Along with leading the team, Millard also works alongside different Fortune500 companies as their management Consultant/Financial Analyst, which shows his passion in helping other businesses grow.
Latest entries
 BusinessSeptember 27, 2026Best Forms Of Passive Income to Build Your Wealth
 Career & LearningSeptember 21, 20266 Most Important Soft Skill Activities for High School Students
 Construction/RepairSeptember 15, 2026Why Does Stamped Concrete Need To Be Sealed
 BeautySeptember 15, 2026What Skin Products do I need? Planning your Routine