
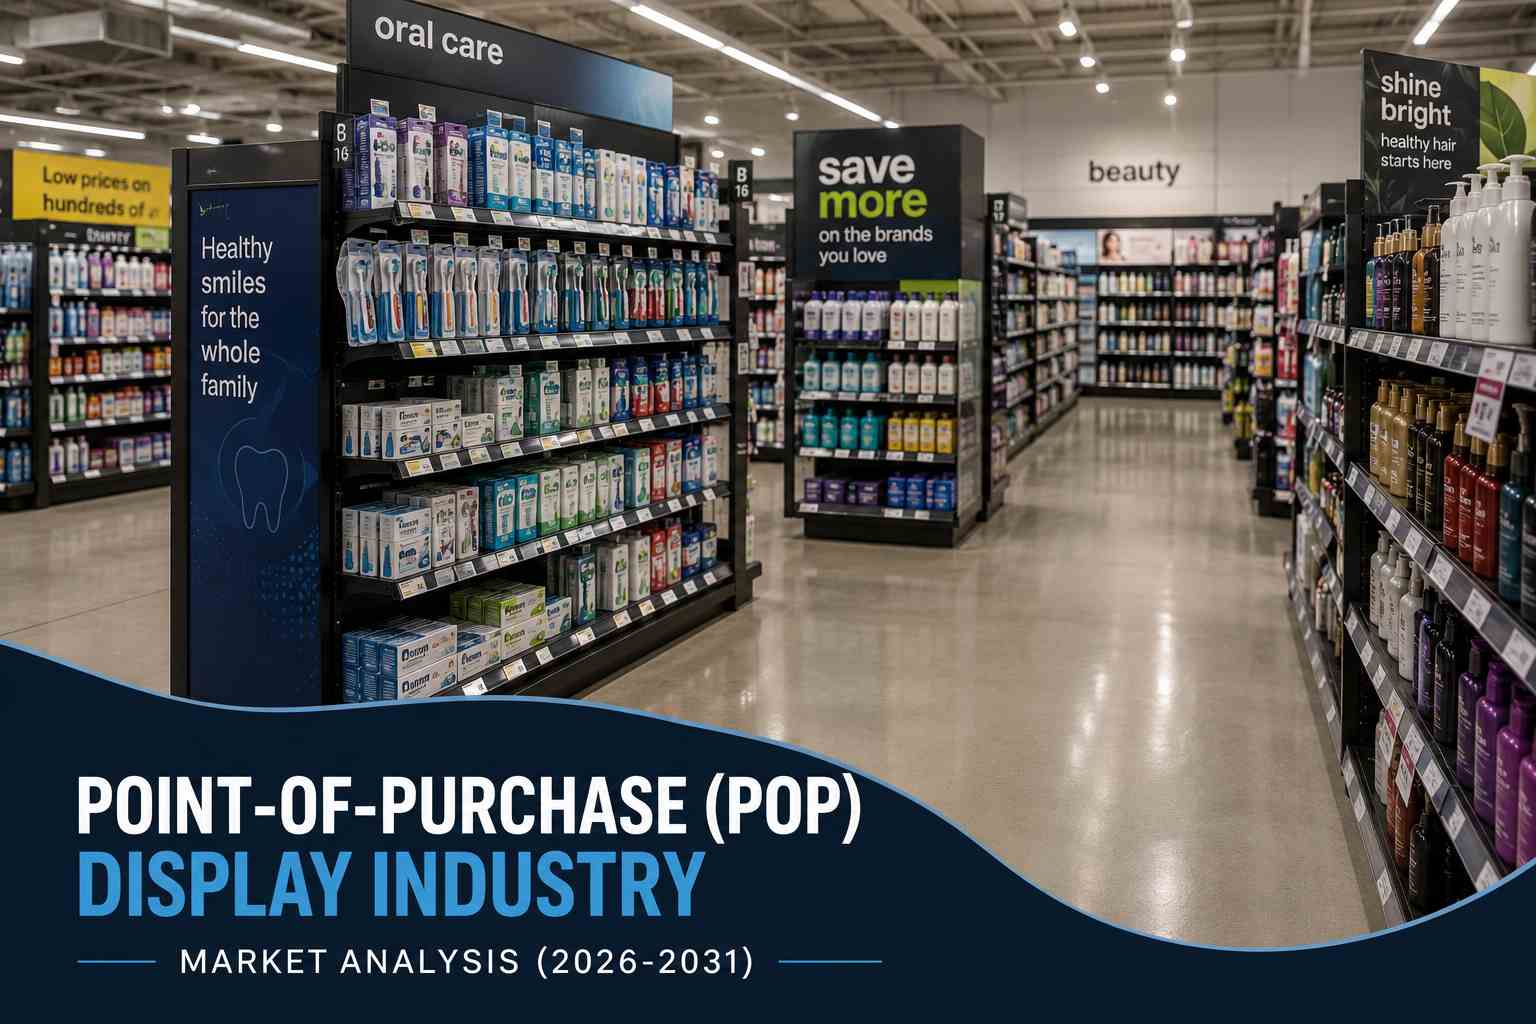
A five-year forward view of market size, competitive structure, regulatory pressure, and where value accrues as fibre, sensors, and trade policy reshape the aisle.
1. Executive Summary
1.1 Synthesis Overview
The point-of-purchase display industry enters 2026 as a mature, moderately fragmented, mid-single-digit growth market. Mordor Intelligence sizes it at USD 17.14 billion in 2026, growing from USD 16.27 billion in 2025, and projects USD 22.23 billion by 2031 at a 5.35% CAGR. That figure sits in the middle of a genuinely wide published range: Spherical Insights puts the 2025 market at USD 16.29 billion with a 5.36% CAGR to 2035, Verified Market Reports anchors at USD 15.4 billion in 2024 with a 5.5% CAGR, Business Research Insights is materially more bearish at USD 12.37 billion in 2026 with a 2.75% CAGR, and 360iResearch is an outlier at USD 26.66 billion in 2025 with a 9.99% CAGR, reflecting a broader definition that absorbs digital and interactive formats. Definitional scope, not disagreement about demand, explains most of the spread.
The directional verdict for 2026 to 2031 is moderate growth. This is not a boom sector, and it is not a declining one. Volume growth is roughly flat to modestly positive in mature markets; value growth comes from material substitution, format upgrading, and the slow migration of promotional budget back toward the physical shelf. Anyone modelling this market on unit counts will miss the story. The money is moving inside the market, not into it.
Three forces define the window. First, regulation is now an operating cost, not a talking point: seven US states enforce packaging extended producer responsibility (EPR) laws, California’s SB 54 regulations took effect on 1 May 2026 with penalties reaching USD 50,000 per day, and the EU Packaging and Packaging Waste Regulation applies from 12 August 2026. Second, retail media has created a measurement expectation the display industry was never built to meet: Forrester projects global retail media spend rising from USD 184 billion in 2025 to USD 312 billion by 2030, yet eMarketer estimates in-store retail media will reach only about USD 1.06 billion by 2028, roughly 0.8% of retail media spend, against a brick-and-mortar channel that still carries the large majority of retail sales. Third, trade policy has inverted the economics of offshore display sourcing, giving domestic converters a structural advantage they did not have five years ago.
The strategic conclusion: the winners over this window will not be the cheapest converters. They will be the ones who can prove a display’s environmental compliance, prove its commercial lift, and deliver it inside a promotional window that keeps shrinking.
1.2 Key Findings
- Market size and trajectory: USD 17.14 billion (2026) to USD 22.23 billion (2031) at 5.35% CAGR per Mordor Intelligence, within a published 2026 range spanning roughly USD 12 billion to USD 27 billion depending on scope definition.
- Verdict: moderate growth. Mid-single-digit value expansion driven by mix shift, not volume.
- Structure: moderately fragmented. Mordor estimates the top five converters hold roughly 35% of combined revenue, leaving substantial room for specialists.
- Material is the battleground: corrugated cardboard held 35.05% share in 2025 and is the political default; foam board is the fastest-growing substrate at 6.1% CAGR; plastic faces substitution pressure from taxes rather than performance.
- Fastest-growing demand pockets: cosmetics and personal care at 7.45% CAGR and department stores at 6.05% CAGR, both outpacing the market.
- Geography: North America is the largest market (Mordor puts its 2025 share at 24.25%; Persistence Market Research puts 2026 nearer 32%, reflecting scope differences). Asia-Pacific is the fastest-growing, at 5.55% CAGR per Mordor and up to 9.4% per Persistence.
- The consolidation wave is done at the top: International Paper closed its USD 7.2 billion DS Smith acquisition on 31 January 2025, and Smurfit Westrock, formed in July 2024, reported USD 19 billion in 2025 net sales. Scale is now set; the next wave is the bolt-on acquisition of regional fabricators.
2. Present-Day Sector Overview
2a. Sector Definition and Scope
Point-of-purchase displays are merchandising fixtures placed at or near the moment of purchase decision to drive unplanned selection, brand switching, or basket expansion. The category spans temporary corrugated formats (floor stands, pallet displays, dump bins, sidekicks, power wings, standees, PDQ trays), semi-permanent hybrids, and permanent fixtures in acrylic, metal, and wood (sign holders, brochure and literature displays, gondolas, lift-and-learn pedestals).
This report treats POP displays as the physical merchandising fixture market. It touches the adjacent digital signage market, which Grand View Research sizes at USD 33.6 billion in 2026, growing to USD 58.4 billion by 2033 at 8.2% CAGR, only where the two converge inside a single fixture. Keeping those markets separate matters: conflating them is the single biggest source of the sizing spread noted above, and it flatters the physical display market’s growth rate by borrowing a screen industry’s CAGR.
By product type, Mordor reports floor displays led with 43.15% share in 2025 and are growing at 5.75% CAGR. By sales channel, supermarkets and hypermarkets held 46.55% of revenue. By end user, food and beverages accounted for 33.65%.
2b. Market Size and Structure
Published market sizing for this sector varies more than for most industrial categories, and the reasons are structural rather than analytical. Much of the market is custom, project-based, privately held, and booked as trade promotion or marketing spend rather than as a capital good, which leaves no clean revenue line to aggregate. Research firms, therefore, draw the boundary differently, and the boundary is worth more than the estimate.
Published POP display market estimates and forecasts
| Source firm | Base figure | Forecast | Implied CAGR |
| Mordor Intelligence | USD 17.14B (2026) | USD 22.23B by 2031 | 5.35% (2026–2031) |
| Spherical Insights | USD 16.29B (2025) | USD 27.45B by 2035 | 5.36% (2026–2035) |
| Verified Market Reports | USD 15.4B (2024) | USD 24.3B by 2033 | 5.5% (2026–2033) |
| Persistence Market Research | Not disclosed publicly | Forecast to 2033 | 5.8% (2026–2033) |
| Market Business Insights | USD 14.8B (2024) | USD 24.5B by 2035 | 4.70% (2025–2035) |
| Business Research Insights | USD 12.37B (2026) | USD 16.07B by 2035 | 2.75% (2026–2035) |
| 360iResearch | USD 26.66B (2025) | USD 52.01B by 2032 | 9.99% (broader scope) |
Excluding the 360iResearch outlier, whose scope absorbs interactive and digital formats, the credible 2026 band is roughly USD 12 billion to USD 17 billion with a consensus CAGR of 4.7% to 5.5%. This report uses Mordor Intelligence’s POP Display Market analysis as the base case, at USD 17.14 billion (2026) to USD 22.23 billion (2031) and 5.35% CAGR, because it is the only major published series whose forecast window matches this report’s exactly.
[IMAGE SUGGESTION: Grouped column chart plotting global POP display market size from 2026 to 2031, showing the Mordor Intelligence base case (USD 17.14B to USD 22.23B) against the low-scope Business Research Insights series and the high-scope 360iResearch series, to visualise the definitional spread. Source: Section 2b table.]
On concentration, Mordor characterises the market as medium concentration and moderately fragmented, with the top five converters holding roughly 35% of combined revenue. That structure is unusual and important: the largest packaging groups on earth compete here against single-plant regional fabricators, and both survive, because the buying decision splits along a line that scale does not cross.
2c. Demand Drivers
The foundational claim underpinning this industry deserves scrutiny. POPAI, now part of the Shop! Association, found in its 2012 Shopper Engagement Study that 76% of purchase decisions were made in-store, up from 70% in 1995, and that roughly one in six brand purchases occurred where a display for that brand was present. That study remains the most-cited number in the sector, and it is now well over a decade old, predating the smartphone-mediated shopping trip, retail media, and quick commerce. It should be treated as directional heritage evidence, not as a current measurement. More recent vendor-side research cited by Frank Mayer indicates 76% of shoppers have discovered a new product or brand from a retail display, and 63% say displays have influenced them, which is supportive but is supplier-commissioned and should be weighted accordingly.
The more defensible drivers are structural:
- The attention arbitrage. Around 80% of consumer spending still happens in physical stores, while roughly 90% of retail media advertising goes to digital channels, per eMarketer. That mismatch is the single largest latent demand pool for in-store fixtures, and it is why retailers are actively building physical media inventory.
- Store footprint stabilisation. Coresight Research projects approximately 7,900 US store closures and 5,500 openings in 2026, a 4.5% decline in closures year over year, and the lowest closure count in three years. The net store base is still shrinking, but the rate of contraction is easing, and the openings skew toward small-format and value chains that use displays intensively.
- Convenience and small-format expansion in emerging markets. Mordor notes small-format stores already represent 73% of modern grocery trade in Indonesia, up from 47% in 2013, and convenience chains plan roughly 10,000 additional Asia-Pacific outlets by 2026. Compact footprints need vertical, modular, knock-down fixtures.
- Measurable in-store touchpoints. Brand owners now expect square-foot accountability. Mordor cites Ferrero’s 2025 Perfect Store programme linking displays to analytics dashboards with SKU-level performance visibility, letting category managers adjust placement mid-promotion rather than post-mortem.
- Fibre substitution as a value driver. Regulatory pressure to replace plastic with fibre is a revenue event for converters even at flat volume, because it forces redesign, retooling, and requalification of existing display programmes.
2d. Value Chain and Unit Economics
The chain runs from resin and containerboard producers, through converters and fabricators, to display agencies and brand owners, and finally into retailer-controlled floor space. Two features dominate the economics.
First, input volatility passes through imperfectly. Mordor reports containerboard rose USD 70 per tonne in January 2025, compressing converter margins and forcing pass-through to brand owners; smaller fabricators absorb this disproportionately because they lack mill integration. This is precisely why International Paper, Smurfit Westrock, and Sonoco compete here at all: containerboard self-sufficiency is a hedge, not a synergy. On the plastics side, IMARC reports US methyl methacrylate at USD 1,863 per tonne in Q1 2026 against USD 1,642 in China, and industry analysis from ZiJunPlastics describes a market defined by cost-driven price increases meeting demand-capped price ceilings, with global PMMA volume rising from 3.06 million tonnes in 2025 to a projected 3.21 million in 2026 and 4.08 million by 2031 at roughly 4.9% CAGR.
Second, retailer floor space is the true scarce asset. As Mordor observes, brands increasingly pay tenancy fees for prime floor real estate, converting store operators into landlords and creating income streams that scale the display market from the retailer side rather than the brand side. This is a material change in who holds pricing power.
2e. Headwinds
Sector headwinds and severity assessment
| Headwind | Severity | Why it bites |
| E-commerce and digital ads are siphoning in-store budgets | High | Mordor assesses this as the largest single drag on forecast CAGR, peaking in North America and Europe. Attributable clicks beat unattributable shelf presence in a CFO review, and ROI uncertainty is delaying budget migration back to fixtures, even where the shopper is. |
| Volatile linerboard and resin pricing | High | Containerboard up USD 70/tonne in January 2025 per Mordor. Converters without mill integration face margin compression that they cannot fully pass through, and are redesigning structures to cut flute weight while holding stacking strength. |
| Tariffs and input cost inflation | High | A universal baseline tariff of at least 10% applies to almost all imports. Section 232 expanded to steel and aluminium derivatives, including moulds, raising tooling costs 10% to 20%. Acrylic distributors report roughly 8% material cost increases attributable to tariffs. |
| Plastics taxes and EPR compliance | Medium | Seven US states now enforce packaging EPR; the UK plastic packaging tax runs at GBP 210.82 per tonne for packs below 30% recycled content. Compliance is a fixed cost that falls hardest on small converters with no dedicated regulatory function. |
| Net store base contraction | Medium | Coresight projects roughly 7,900 US closures against 5,500 openings in 2026. Fewer doors means fewer display placements, though the rate of decline is easing and the mix is improving. |
| Shrink-floor retail concepts are lowering display density | Medium | Smaller store formats and tighter planograms reduce the number of large fixtures a store can physically carry, capping unit growth in mature markets. |
| Reliance on dated shopper research | Medium | The sector’s core proof point, POPAI’s 76% in-store decision rate, dates to 2012. Buyers increasingly ask for contemporary, closed-loop measurement that most suppliers cannot yet produce. |
| Fragmentation and price commoditisation | Low | With the top five holding only about 35% of revenue, commodity corrugated work is bid aggressively. This suppresses margins but is a known, structural feature rather than a deteriorating one. |
3. Competitive Landscape
3a. Market Leaders
The top of this market is not made up of display companies. It is made of integrated packaging groups for whom displays are a high-margin attachment to a containerboard business. Mordor names DS Smith, WestRock, Smurfit Kappa, International Paper, and Stora Enso as industry leaders; two of those five have since been absorbed into the other two. That consolidation is the defining structural fact of the last 24 months.
Leading players in the POP display market
| Company / HQ | Market Position | Core Offering | Competitive Moat | Recent Moves | Growth Trajectory |
| Smurfit Westrock (Dublin, IE / Atlanta, US) | Largest listed packaging group; top-tier display converter | Corrugated packaging, consumer packaging, merchandising displays, bag-in-box | Containerboard self-sufficiency; 40+ country footprint; named merchandising display capability inside a USD 19bn revenue base | Formed July 2024 via the Smurfit Kappa and WestRock combination; reported USD 19bn net sales and USD 3.0bn adjusted EBITDA for 2025; Q1 2025 revenue USD 7.656bn | Moderate. Integration synergies drive margin more than volume. |
| International Paper (Memphis, US / London, UK) | Global scale leader in fibre packaging; major display converter via DS Smith | Corrugated packaging, containerboard, retail-ready packaging, and displays | Roughly 90% of revenue from sustainable fibre-based packaging, mill integration, combined EMEA and North America box network | Closed USD 7.2bn (GBP 5.8bn) DS Smith acquisition 31 January 2025, targeting at least USD 514m synergies; reports rising orders for fibre units substituting plastic | Moderate. Fibre substitution is a direct tailwind. |
| Sonoco Products (Hartsville, US) | Focused consumer and industrial packaging player | Consumer packaging, industrial paper packaging | Post-restructuring simplicity; metal and fibre consumer packaging depth | Acquired Eviosys (Dec 2024, USD 3.8bn); divested ThermoSafe (USD 656m cash) and thermoform/flexibles (approx USD 1.8bn) in 2025; cut net debt by approx 40%; 2026 guidance USD 7.25bn to USD 7.75bn net sales across two segments | Flat to moderate. Displays are peripheral to the reshaped portfolio. |
| Menasha Packaging (Neenah, US) | Leading North American merchandising and display specialist | Temporary corrugated standees, merchandising units, permanent wood, metal, and plastic structures | Deep merchandising-first specialisation rather than mill-led attachment; national retail relationships | Continues as a named leader across the POP market analyses; 1,000+ employees with estimated revenue above USD 250m | Moderate. Benefits from specialist positioning as generalists consolidate. |
| Great Northern Instore (Appleton, US) | Major independent custom display manufacturer | Temporary, semi-permanent, permanent, and interactive displays; in-house design and engineering | Fully in-house design-to-manufacture; retail playbook and shopper insight layer that commodity converters lack | Operates Creative Displays Now!, cited by Mordor as a display-as-a-service pioneer, bundling design, install, analytics, and end-of-life recovery into a single fee | Above market. Service model shifts capex to opex for brand owners. |
| Frank Mayer and Associates (Grafton, US) | Premium interactive and kiosk-led display specialist | Custom retail display programmes, self-service kiosks, interactive experiences | Since 1931, nine decades of consultative programme work; kiosk engineering capability few display firms hold | Client roster includes Garmin, PPG Paints, LEGO, GE Lighting, and PGA Tour Superstore; debuted Instore Digital + Merchandising Ecosystem with Elo at NRF | Above market. Sits where displays and retail media converge. |
| Georgia-Pacific (Atlanta, US) | Large integrated converter with display capability | Corrugated packaging and retail display structures | Koch-backed balance sheet; containerboard integration; scale procurement | Consistently named among the leading POP converters across Research and Markets and Mordor analyses | Flat to moderate. Scale player, not a category innovator. |
[IMAGE SUGGESTION: Competitive positioning scatter plot mapping named leaders on two axes: containerboard/mill integration (low to high) versus merchandising specialisation (low to high), with bubble size representing revenue scale. Illustrates the barbell structure described in Section 3a. Source: Section 3a table.]
3b. Emerging Challengers and Specialists
Because the top five hold only about 35% of revenue, the challenger tier is unusually consequential in this market. It is divided into four groups.
- Display-as-a-service operators. Creative Displays Now! (Great Northern Instore) bundles design, installation, analytics, and end-of-life recovery into a subscription fee. This directly answers two buyer objections at once: capex aversion and EPR end-of-life liability. Mordor flags modular display-as-a-service rental as a distinct forecast driver.
- Sensor and printed-electronics start-ups. Firms supplying conductive inks and plug-and-play modules that display pricing or count shoppers without external power. Milesight’s VS133 AI time-of-flight sensor network is deployed across more than 700 stores, capturing dwell time and conversion; Mordor cites Raydiant reporting sales uplift of up to 180% where interactive screens replace static graphics.
- On-demand and 3D-printed fabricators. Proto Labs and similar operations compress display accessory iteration from weeks to days, enabling ultra-short-run custom units. Mordor treats 3D printing as a long-term (four years plus) driver.
- Regional material specialists. Single-plant fabricators compete on speed, low minimums, and domestic origin rather than price per unit. Displays & Holders, Quality Packaging, and IDL Displays operate in this tier. Mordor explicitly notes these firms are acquisition targets as larger groups seek last-mile fulfilment footprints near urban consumption centres.
3b.1 Company Spotlight: Displays & Holders
Displays & Holders (displaysandholders.com) is a family-owned acrylic display manufacturer in Anaheim, California, operating since 1986. The company began printing T-shirts for customers, including Disney, Honey Baked, and Knott’s Berry Farm, and evolved into acrylic fabrication, describing itself today as one of the largest acrylic manufacturers and sign makers in the United States. It is a specialist, not a scale player, and it should be read against the leaders in Section 3a as a different business model rather than a smaller version of the same one.
Sub-segment and business model. The company plays in permanent and semi-permanent acrylic fixtures: sign holders, brochure and literature displays, stands, and custom-fabricated units in stock, moulded, and bespoke configurations. All fabricating, imprinting, and shipping are performed in-house at the Anaheim plant. It also operates fulfilment services covering picking, packing, kitting, and drop-shipment to multiple locations, which places it in the display-plus-logistics tier rather than pure fabrication. That combination is deliberate, and it is the more interesting half of the business, because it addresses vendor-consolidation pressure at the buyer rather than price pressure at the quote.
Differentiation and moat. Three things separate the company from typical acrylic suppliers. Custom minimum order quantity is 50 units against an industry-typical 500 or more, which opens custom fabrication to buyers that the volume converters cannot serve economically. Same-day shipping applies to in-stock items ordered before 2 PM PST, with custom lead times generally 5 to 7 business days. And all production is domestic, at a moment when a universal baseline tariff of at least 10% plus Section 232 derivative coverage has raised landed cost on imported acrylic and tooling; distributors report roughly 8% material cost inflation attributable to tariffs alone. The moat here is not technology. It is a cost structure and a decision latency that a container ship cannot match. Consistent with the company’s own framing, it competes on being the supplier that answers the phone and hits the date, which, in a sector where a missed promotional window is a total loss, is a substantive claim rather than a soft one.
Honest competitive read. The company is positioned to win in three specific places over this window. Permanent acrylic fixtures are a durable-goods purchase largely insulated from the temporary corrugated promo cycle that carries most of the market’s volatility. The single-use packaging definitions anchoring SB 54 and the EU PPWR are aimed at packaging and food service ware rather than durable in-store fixtures, which leaves permanent acrylic outside the sharpest edge of the statutory regime, even as corporate ESG procurement policy reaches it anyway. And the 50-unit minimum captures a long tail of small and mid-market buyers that the consolidated top of the market has structurally abandoned.
The pressures are equally real and should not be minimised. Acrylic is a virgin-plastic story in a market where fibre has become the procurement and political default: Mordor’s forecast explicitly treats fibre-based corrugated replacing plastics as a long-term growth driver and plastics taxation as a restraint, and industry pricing analysis notes that acrylic demand in advertising and signage has been contracting under pressure from digital media. Second, a single Anaheim plant is a speed advantage on the West Coast and a freight disadvantage everywhere else, against national converters with multi-site networks. Third, the fastest-growing part of this market is instrumented: sensors, QR integration, and retail-media-linked fixtures. There is no public evidence that the company has a measurement or analytics layer, and the sector is moving toward buyers who expect one. Fourth, permanent fixtures carry longer replacement cycles, which stabilises revenue but caps the growth rate relative to promo-cycle converters. None of these is fatal. All of them are strategic choices that need to be made deliberately rather than by default, and Section 5 addresses them directly.
3c. Competitive Intensity: Porter’s Five Forces
Porter’s Five Forces assessment, POP display industry 2026
| Force | Rating | Rationale |
| Bargaining power of suppliers | Medium to High | Containerboard and resin producers set input costs that converters cannot fully pass through; containerboard rose USD 70/tonne in January 2025. Integrated players neutralise this by owning the mill; independents cannot. |
| Bargaining power of buyers | High | Brand owners face low switching costs across a fragmented supplier base, and retailers control the scarce asset (floor space) and increasingly charge tenancy for it. Buyers now demand measurable ROI, adding a further condition to every renewal. |
| Threat of new entrants | Medium | Capital intensity is low for basic corrugated conversion, and 3D printing lowers prototyping barriers further. But EPR compliance infrastructure, retailer approval processes, and national fulfilment reach are meaningful non-capital barriers that new entrants underestimate. |
| Threat of substitutes | High | The substitute is not another display. It is digital advertising. Mordor assesses e-commerce and digital ads siphoning in-store budgets as the single largest negative driver on forecast CAGR. Retail media, growing toward USD 312bn globally by 2030 per Forrester, competes for the same promotional dollar. |
| Intensity of competitive rivalry | High | Medium concentration, with the top five holding roughly 35% of revenue, means the long tail bids aggressively on commodity work. Recent megadeals raised scale at the top without materially raising concentration, so price competition persists in the middle. |
The composite read is a structurally difficult market: high buyer power, high substitute threat, high rivalry, and supplier power that only mill-integrated players can neutralise. Mid-single-digit growth in a market with these forces is not a disappointment. It is a reasonable outcome, and it explains why returns concentrate in the specialist and service-model tiers rather than in commodity conversion.
4. Forward Outlook 2026–2031
4a. Market Projections: Bull, Base, Bear
The base case is Mordor Intelligence’s published series. The bull and bear cases are reasoned scenarios built by applying alternative published CAGRs to the same 2026 base, not published forecasts in their own right, and are labelled as such.
Scenario projections to 2031, from a USD 17.14 billion 2026 base
| Scenario | 2031 market size | Implied CAGR | Key assumption |
| Bull | Approx USD 24.6bn (reasoned estimate) | Approx 7.5% | In-store retail media breaks out of its ~0.8% share of retail media spend and pulls physical merchandising budget back toward the 80% of consumption that happens in-store. EPR-driven redesign forces wholesale replacement of existing display fleets, creating a one-off retooling wave. Asia-Pacific c-store rollouts land at the upper end. |
| Base | USD 22.23bn (Mordor Intelligence, published) | 5.35% | Fibre substitution proceeds steadily, sensor integration scales gradually in North America and Europe, store closures continue easing, and input costs stay volatile but pass through with a lag. No macro shock. |
| Bear | Approx USD 19.6bn (reasoned estimate) | Approx 2.75% | Applies Business Research Insights’ 2.75% CAGR. Digital advertising continues to win the promotional dollar on attribution grounds, tariffs and resin costs suppress volume, and shrink-floor formats accelerate. Growth becomes almost purely price-driven. |
[IMAGE SUGGESTION: Grouped column chart comparing bull, base, and bear market size at 2031 (USD 24.6bn / 22.23bn / 19.6bn) against the USD 17.14bn 2026 base, with CAGR labelled on each column. Source: Section 4a table.]
The spread between bull and bear is roughly USD 5 billion, or about 25% of the base case. That is a narrow band by market-forecast standards, and it reflects a real property of this sector: it is neither disrupted nor disruptive. Even the bear case is growing. Even the bull case is not a boom.
4b. Structural Shifts
Four shifts will reshape competitive position independently of the headline number.
- From product to service. Display-as-a-service converts a capex purchase into a subscription and moves end-of-life liability from the brand to the supplier. Under the EPR regime, the liability now has a price, which makes the service model more valuable in 2031 than it was in 2026.
- From fixture to media inventory. When a retailer charges tenancy for floor space, the display becomes an advertising placement rather than a merchandising tool. This changes who specifies it, who pays, and what evidence is required at renewal.
- From cost per unit to cost per landed compliant unit. Tariffs plus EPR fees plus recycled-content requirements mean the quoted unit price is now a poor proxy for total cost. Suppliers who can quote landed and compliant will win bids they would previously have lost on price.
- From national converters to last-mile fabricators. Mordor expects larger groups to acquire regional fabricators for urban fulfilment reach. Freight economics on bulky, low-density fixtures make proximity a durable advantage, which is why the fragmented tail persists.
4c. Technology and Innovation Vectors
Technology vectors and expected maturity by 2031
| Technology | What it changes | Maturity by 2031 |
| Embedded sensors and computer vision | Turns a fixture into a measurement device. Milesight’s VS133 AI time-of-flight network already spans 700+ stores, capturing dwell and conversion. The Business Research Company sizes computer vision for retail at USD 5.24bn in 2026, rising to roughly USD 12.19bn by 2030 at nearly 23.8% CAGR. | Mainstream in North America and Europe; standard on premium fixtures. |
| Fibre and bio-composite substrates | Replaces plastic structurally. Nano-liner R&D cuts grammage without losing stacking strength; bio-composite boards blend cellulose with crop residue. Corrugated already holds 35.05% share and is the regulatory default. | Mature and dominant. The default substrate for anything short-lived. |
| Foam board and high-definition print | Delivers print fidelity, acrylic, and corrugated cannot match at the price, driving premium cosmetics and electronics fixtures. Fastest-growing material at 6.1% CAGR per Mordor. | Established niche leader in premium categories. |
| Recycled-content plastics (rPMMA, rPETG, styrene) | Keeps plastic viable under EPR. Industry suppliers report that display plastics, including acrylic, PETG, and styrene, are now available at 25% to 100% recycled content without quality loss. | Commercially available now; becomes a procurement requirement rather than a differentiator. |
| Display-as-a-service and modular rental | Shifts capex to opex and transfers end-of-life liability. Mordor treats it as a short-term (two years or less) driver with relevance to North America and Europe. | Established as a mainstream commercial model. |
| 3D printing for ultra-short runs | Compresses accessory iteration from weeks to days, enabling economically viable runs of tens rather than hundreds. Mordor treats it as a long-term (four years plus) driver. | Emerging. Prototyping standard; production niche. |
| Electronic shelf labels and dynamic headers | Let’s make a single fixture change creative by daypart without relabelling. Walmart’s rollout of digital price screens across 2,300 stores represented a USD 200m capital programme per Mordor. | Mainstream in grocery; expanding into other formats. |
4d. Sub-Segment Growth Outlook
Sub-segment positions and outlook to 2031
| Sub-segment | 2025 position | Outlook to 2031 | Read |
| Cosmetics and personal care (end user) | Growing category | 7.45% CAGR | Fastest-growing end market. Try-and-buy interaction is the one thing e-commerce structurally cannot replicate. Refillables and travel minis demand bespoke organisers. |
| Department stores (channel) | Minority share | 6.05% CAGR | Fastest-growing channel. Beauty halls and luxury corners are rebuilding as experience hubs; motion-triggered visuals lift fragrance dwell time 18% per Sensalytics. |
| Foam board (material) | Minority share | 6.1% CAGR | Fastest-growing substrate. Print fidelity wins premium work without steel-frame cost. |
| Floor displays (product) | 43.15% share | 5.75% CAGR | Largest segment growing above market. Scale allows embedded sensors, QR, and NFC, making it the natural retail-media carrier. |
| Corrugated cardboard (material) | 35.05% share | At or near market rate | Volume leader and regulatory default. Growth is steady rather than spectacular because it is already the incumbent. |
| Supermarkets and hypermarkets (channel) | 46.55% share | At or below market rate | Revenue anchor. Weekly traffic and wide aisles sustain it, but the channel is mature, and store counts are not expanding. |
| Food and beverages (end user) | 33.65% share | At or below market rate | Largest end market, driven by purchase frequency and seasonal pallet campaigns. Reliable, not a growth engine. |
[IMAGE SUGGESTION: Horizontal bar chart ranking POP display sub-segments by projected CAGR to 2031 (cosmetics and personal care 7.45%, foam board 6.1%, department stores 6.05%, floor displays 5.75%, market average 5.35%), with a reference line at the 5.35% market CAGR to show which segments outpace the market. Source: Section 4d table.]
4e. Regulatory and Policy Outlook
Regulation moved from pending to enforced during this report’s base year, and this is the single most consequential change in the sector’s operating environment.
- United States, packaging EPR. Seven states now enforce packaging EPR laws: Maine, Oregon, Colorado, California, Minnesota, Maryland, and Washington. All seven required producer registration or supply-data reporting by 31 May 2026, the first simultaneous multi-state compliance deadline in EPR history.
- California SB 54. The Office of Administrative Law approved permanent regulations on 1 May 2026, effective on filing, with a 1 June 2026 producer registration deadline. CalRecycle estimates more than 5,700 producers in scope; non-compliance penalties reach USD 50,000 per day. Circular Action Alliance is the sole approved Producer Responsibility Organisation and submitted its PRO Plan on 15 June 2026. Full programme implementation begins 1 January 2027. By 2032, the law requires 100% of single-use packaging sold in California to be recyclable or compostable, a 65% recycling rate for single-use plastic packaging, and a 25% reduction in single-use packaging.
- European Union PPWR. The Packaging and Packaging Waste Regulation applies from 12 August 2026, imposing recyclability requirements, reuse targets, a PFAS ban in food packaging, deposit-return obligations, and strengthened EPR.
- Plastics taxation. The UK plastic packaging tax runs at GBP 210.82 per tonne for packs containing less than 30% recycled content; Germany’s VerpackG and Canada’s EPR regime create parallel pressure toward curbside-certified, chain-of-custody-documented substrates.
- Trade policy. A universal baseline tariff of at least 10% applies to almost all imports regardless of origin, with Section 232 expanded to steel and aluminium derivative products, including moulds, raising imported tooling costs 10% to 20%.
- Live legal uncertainty. In February 2026, a federal district court in Oregon granted a preliminary injunction in an industry challenge to that state’s EPR law. The outcome could materially affect existing state EPR programmes and the design of future ones. Separately, the UN Intergovernmental Negotiating Committee on Plastic Pollution adjourned in August 2025 without consensus on a global plastics treaty, with governments expected to return during 2026.
The practical implication for converters is that compliance capability has become a competitive asset. A supplier who can document recycled content, chain of custody, and curbside recyclability wins bids from suppliers who cannot, at the same price. Scope also matters: these regimes are anchored on single-use packaging and food service ware definitions, which place durable in-store fixtures outside their sharpest edge, while corporate ESG procurement policy continues to reach them regardless.
4f. Geographic Hotspots
North America remains the largest market. Mordor puts its 2025 share at 24.25%; Persistence Market Research places 2026 nearer 32% and Business Research Insights at 36%, with the spread again reflecting scope. Growth here comes from retail-media rollouts and capacity investment: Mordor cites WestRock’s automated Wisconsin superplant expanding corrugated capacity and shortening lead times, and Green Bay Packaging committed USD 1 billion in June 2025 to expand its Arkansas kraft-liner facility. US grocers increasingly monetise end-cap inventory through programmatic booking systems, bundling digital kiosks with fibre units.
Asia-Pacific is the fastest-growing region, though by how much depends on the source: Mordor projects 5.55% CAGR through 2031, while Persistence projects approximately 9.4% through 2033. The drivers are consistent across sources. Convenience chains plan roughly 10,000 additional outlets by 2026. Chinese smart-retail operators retrofit stores with AI-driven planogram optimisation that compresses refresh cycles from weeks to hours. India’s organised retail corridor is adding second-tier city malls. Southeast Asian formats, typically under 200 square metres, drive demand for slim, fold-flat towers shipped as knock-down kits to control freight. IndexBox estimates the broader Asia-Pacific retail displays market, including digital signage and electronic shelf labels, at USD 18 billion to USD 22 billion in 2026, with China accounting for 35% to 40% of regional demand while also serving as the dominant production hub.
Europe’s market is defined by sustainability regulation rather than growth. The UK plastic tax and Germany’s VerpackG push closed-loop substrates; retailers demand chain-of-custody certification, driving FSC-certified corrugated and water-based inks. French hypermarkets are trialling paper-based cooler claddings that resist condensation, extending fibre into refrigerated aisles. Premium positioning in cosmetics and gourmet food sustains unit values against volume softness in price-sensitive categories.
[IMAGE SUGGESTION: Regional bar chart or choropleth map showing POP display market CAGR by region to 2031 (Asia-Pacific 5.55%, North America and Europe at or below the 5.35% global average), annotated with North America’s 24.25% 2025 revenue share as the largest market. Source: Section 4f, Mordor Intelligence regional data.]
4g. Risk Register
Risk register 2026–2031
| Risk | Probability | Impact | Mitigation |
| Digital ad attribution permanently wins the promotional budget | High | High | Attach measurement to fixtures. Partner with sensor and vision vendors rather than building. Sell closed-loop lift data, not shelf presence. |
| Input cost volatility compresses converter margins | High | Medium | Redesign for lower grammage; index contracts to containerboard and resin benchmarks; shorten quote validity windows. |
| Tariff escalation raises the landed cost of imported material and tooling. | Medium to High | Medium | Qualify domestic and nearshore suppliers; quote landed cost rather than unit cost; treat domestic origin as a priced feature. |
| EPR compliance burden falls disproportionately on small converters | High | Medium | Join a PRO early; document recycled content and chain of custody as a standing capability, not a per-bid scramble. |
| Oregon EPR injunction unwinds or fragments state EPR regimes | Medium | Medium | Design for the strictest jurisdiction regardless of litigation outcome. Regulatory reversal creates no cost for a compliant supplier; regulatory tightening destroys a non-compliant one. |
| Accelerated store closures beyond Coresight’s 7,900 projection | Low to Medium | Medium | Diversify across channels and categories. Cosmetics, department stores, and convenience exposure hedges grocery concentration. |
| Retailers vertically integrate display supply to capture media margin | Low | High | Become the supplier retailers cannot replicate: speed, low minimums, or specialist fabrication rather than commodity conversion. |
| Black swan: binding global plastics treaty with production caps | Low | Very High | UN INC negotiations adjourned without a consensus in August 2025 and resumed in 2026. A binding treaty limiting virgin polymer production, rather than managing waste, would strand plastic-based display capacity almost overnight and force a disorderly fibre migration on a timeline the industry cannot absorb. Any plastics-exposed converter should hold a costed fibre and recycled-content contingency plan. |
5. Strategic Implications
5a. Where Value Accrues
Three pools capture disproportionate value over this window, and none of them is commodity conversion.
Compliance as a product. When California can fine at USD 50,000 per day and seven states enforce simultaneously, a supplier who can hand a brand owner documented recycled content, chain of custody, and curbside recyclability is selling risk transfer, not cardboard. That is a margin position, and it is defensible because it is administratively expensive to replicate rather than technically hard.
Measurement attachment. The gap between where consumption happens (roughly 80% in-store) and where retail media spends (roughly 90% digital) is the sector’s largest unclaimed pool. Whoever closes it captures it. This does not require building sensor technology; it requires partnering and owning the reporting relationship. Frank Mayer’s Elo partnership is the template.
Speed and minimum-order flexibility. As promotional windows compress and store formats fragment, the ability to produce 50 units in a week beats the ability to produce 50,000 in six. This is where regional fabricators structurally beat integrated groups, and it is the one advantage tariffs have made more valuable rather than less.
5b. Capability Requirements
To hold position through 2031, a supplier in this market needs five capabilities. First, a documented sustainability data layer covering recycled content, substrate certification, and end-of-life pathway per SKU, maintained continuously rather than assembled per bid. Second, landed-cost quoting that prices tariff exposure, freight, and compliance fees rather than unit cost alone. Third, a measurement partnership so that fixtures can report engagement without the supplier becoming a technology company. Fourth, material optionality: the ability to quote the same programme in fibre, foam board, recycled plastic, or acrylic, and to explain the tradeoff credibly. Fifth, either mill integration or genuine speed. There is no viable middle position between the two, and the firms currently occupying it are the acquisition targets Mordor anticipates.
5c. Marketing and Go-to-Market
Go-to-market in this sector fails when it addresses a single buyer. The purchase is split across at least three people with incompatible decision criteria, and the supplier who wins is the one who arms each of them separately. Using Displays & Holders’ own segmentation as the working model, because it maps cleanly onto how this market actually buys:
The small-business buyer (in Displays & Holders’ framing, Retail Rachel: an owner or manager of a 1 to 50 employee retail business turning over USD 500,000 to USD 5 million) buys on affordability, speed, and the ability to order below volume minimums. This buyer is not reachable through trade media and does not run an RFP. She is reached through local business networks and chambers of commerce, visual social channels showing before-and-after retail transformations, small-business publications, and retail association outreach. The message that lands is that a professional in-store presentation is available without a volume commitment, which is exactly the gap a 50-unit minimum fills against a 500-unit industry norm.
The mid-market marketing manager (Marketing Mike) buys on brand consistency across locations and on-time delivery, because a display that arrives late does not arrive at a reduced value; it arrives at zero value. This buyer is reached through retail, hospitality, and franchise trade shows, B2B marketing publications, LinkedIn, multi-location case studies, and direct outreach into marketing departments. The proposition is end-to-end vendor consolidation: manufacturing, imprinting, fulfilment, and distribution under one accountable partner, which removes coordination overhead rather than just supplying an object.
The enterprise procurement manager (Procurement Pete) buys on supply-chain risk, cost targets, and ESG alignment, and in 2026, those three have converged. Domestic manufacturing now answers all three at once: it removes tariff and freight exposure, it shortens lead time, and it produces the documentation an ESG report requires. This buyer is reached through procurement and supply-chain conferences, B2B procurement platforms, supply-chain publications, and ROI analyses that quantify landed cost rather than quoting unit price. The critical enablement asset is not a brochure. It is a substantiated data pack: recycled content by SKU, chain of custody, and a costed end-of-life pathway.
One cross-cutting point. Every one of these buyers is now asking a question the sector has historically answered with a 2012 statistic. Suppliers who continue to cite POPAI’s 76% in-store decision rate as their proof point are competing with an artefact against digital channels that report closed-loop attribution weekly. Contemporary, first-party evidence of lift is becoming the price of entry to the conversation, and it is the single highest-leverage marketing investment available in this market.
6. Conclusion and Directional Outlook
6a. The Verdict
Moderate growth. The point-of-purchase display market expands from USD 17.14 billion in 2026 to USD 22.23 billion in 2031 at a 5.35% CAGR in the base case, with a reasoned bull case near USD 24.6 billion and a reasoned bear case near USD 19.6 billion. The band is narrow because the sector is neither being disrupted nor doing the disrupting. It is being reorganised from the inside.
The headline number conceals the actual story, which is a set of simultaneous migrations: from plastic to fibre under regulatory pressure, from product to service under EPR liability, from fixture to media inventory under retailer landlord economics, and from offshore to domestic under tariff economics. A converter can grow at twice the market rate or shrink against it while the market does exactly what the forecast says. Position determines outcome here far more than the sector’s growth rate does.
For specialist fabricators, the window is genuinely favourable but conditionally so. Tariffs have handed domestic producers a cost advantage they did not earn and cannot rely on permanently. Fragmentation has left a long tail of buyers that the consolidated top of the market cannot serve. Speed has become more valuable as promotional windows compress. The condition is measurement: the buyer’s question has changed, and suppliers who cannot answer it will lose bids they would have won on price and quality in 2019.
6b. Recommended Actions
- Build a per-SKU sustainability data pack and treat it as sales collateral, not compliance overhead. Document recycled content, substrate certification, chain of custody, and end-of-life pathway for every product line, and design to the strictest jurisdiction (California SB 54 and the EU PPWR) regardless of where the order ships. This converts a fixed regulatory cost into a bid-winning asset and hedges the Oregon injunction either way: if EPR tightens, you are ready; if it loosens, you have lost nothing.
- Re-quote the book on landed cost rather than unit price. With a universal baseline tariff of at least 10%, Section 232 covering steel and aluminium mould derivatives at 10% to 20%, and roughly 8% acrylic material inflation attributable to tariffs, the unit price on an imported quote no longer predicts the total. Domestic producers are currently winning bids they are losing on paper. Fix the paper.
- Attach measurement by partnership, not by build. Contract with a sensor or vision vendor (the Milesight and Elo model) to add engagement reporting to premium fixtures. Own the reporting relationship with the brand owner. The goal is to replace a 2012 statistic with this quarter’s dwell and conversion data, because that is the evidence standard retail media has set, and the sector will be held to it.
- Aim new business development at the two segments outpacing the market: cosmetics and personal care (7.45% CAGR) and department stores (6.05% CAGR). Both reward exactly what permanent and semi-permanent fixture specialists do well, tactile try-and-buy interaction and high print and finish fidelity, and both are structurally defended against e-commerce substitution in a way that grocery pallet promotion is not.
- Decide the material question deliberately in the next twelve months. Either commit to recycled-content plastics (rPMMA, rPET, G, and styrene are commercially available at 25% to 100% recycled content) and market the durability-versus-single-use argument explicitly, or add a fibre and foam-board line to sit alongside the plastic business. Holding a virgin-plastic-only position through 2031 without a costed contingency is the one strategic choice in this market with genuine tail risk, given a plastics treaty that adjourned without consensus rather than concluding.
Author Profile

- Along with leading the team, Millard also works alongside different Fortune500 companies as their management Consultant/Financial Analyst, which shows his passion in helping other businesses grow.
Latest entries
 BusinessOctober 3, 202619 Tips to Prepare for a Virtual Interview
 BusinessSeptember 27, 2026Best Forms Of Passive Income to Build Your Wealth
 Career & LearningSeptember 21, 20266 Most Important Soft Skill Activities for High School Students
 Construction/RepairSeptember 15, 2026Why Does Stamped Concrete Need To Be Sealed